Inflation Under U.S. Presidents: 65 Years of CPI Data, Without the Political Spin
By TopHolding Editorial · Wednesday, May 13, 2026 at 10:33 AM
From Nixon's oil shock to Carter's 13.3% peak, Volcker's rate hammer, Bush II's 2008 collapse, and the post-COVID surge under Biden — every president inherits an inflation backdrop and hands one off. Here is what the BLS data actually shows from 1960 to today.
Inflation is the most politically weaponized number in American economics. Every administration claims credit when it is low and blames its predecessor when it is high. The Bureau of Labor Statistics has been measuring it the same way for decades. The data settles most of the arguments.
The chart below shows annual inflation under every U.S. president since 1960, color-coded by who occupied the Oval Office. A few patterns are obvious: presidents do not control inflation in any single-year sense. Oil shocks, wars, pandemics, and Federal Reserve policy do most of the work. But fiscal choices matter — and the cumulative damage of the high-inflation decades is permanent.
The Quiet 1960s
Kennedy and Johnson presided over a remarkably calm price environment. From 1961 to 1965, inflation never exceeded 1.9%. The Vietnam War buildup and the Great Society programs began pushing prices up by 1968 (4.7%) — the first warning that fiscal expansion without tax increases creates trouble. The bill came due under the next administration.
Nixon, Wage-Price Controls, and the First Oil Shock
By 1969, inflation hit 6.2%. Nixon's response was extraordinary: in August 1971 he imposed nationwide wage and price controls, the only peacetime use of such powers in modern American history. They worked briefly. Then the 1973 OPEC oil embargo quadrupled crude prices and inflation jumped to 8.7% under Nixon, then 12.3% under Ford in 1974 — the highest reading in a generation.
The Great Inflation: Carter's 13.3% Peak
This is the era most Americans alive today still reference when they say "inflation." Under Carter, CPI hit 13.3% in 1979 and 12.5% in 1980. Mortgage rates crossed 18%. Gold tripled. The dollar lost roughly a third of its purchasing power in four years. The cause was a combination of two oil shocks, accommodative Fed policy under Arthur Burns, and a federal government still funding Vietnam-era programs without paying for them.
The Volcker Hammer (Reagan)
Paul Volcker, appointed by Carter and re-appointed by Reagan, took the federal funds rate to 20% in 1981. He triggered a brutal recession — unemployment hit 10.8% in 1982 — but he broke inflation's back. CPI fell from 12.5% in 1980 to 3.8% by 1982, and stayed under 5% for almost the entire decade. Reagan got the political credit. Volcker did the work.
The Great Moderation (Bush I, Clinton, early Bush II)
From 1983 to 2007, inflation averaged roughly 3% per year — what economists later called "the Great Moderation." Globalization, China's entry into the WTO in 2001, and credible Fed inflation-targeting under Greenspan all contributed. Even the 1990 Iraq oil spike and the 2000 dot-com bust barely registered in the CPI.
2008: When Inflation Briefly Disappeared
The global financial crisis under George W. Bush did something the prior 50 years had not: it produced a year of essentially zero inflation. CPI for 2008 came in at 0.1% — the lowest annual reading since 1955 — as collapsing oil and housing demand overwhelmed everything else. Obama inherited that disinflationary backdrop, which is one reason inflation never became a political issue during his eight years.
The Trump I Calm Before the Storm
Trump's first term inherited the late stages of the longest expansion in U.S. history. Inflation averaged 1.9% per year from 2017 to 2020 — the lowest sustained run since the early 1960s. The pandemic briefly turned it negative in spring 2020 as oil prices went negative and travel collapsed. The trillions in CARES Act stimulus and Federal Reserve emergency programs were the seeds of what came next.
The Post-COVID Surge: Biden and the 41-Year High
Biden took office with inflation at 1.4% in January 2021. By April it was 4.2%. By June 2022 it hit 9.1% — the highest since November 1981. The causes are still debated: pent-up demand from $5 trillion in cumulative pandemic stimulus, supply-chain breakdowns, energy disruptions from the Russia-Ukraine war, and a Federal Reserve that famously called inflation "transitory" until late 2021.
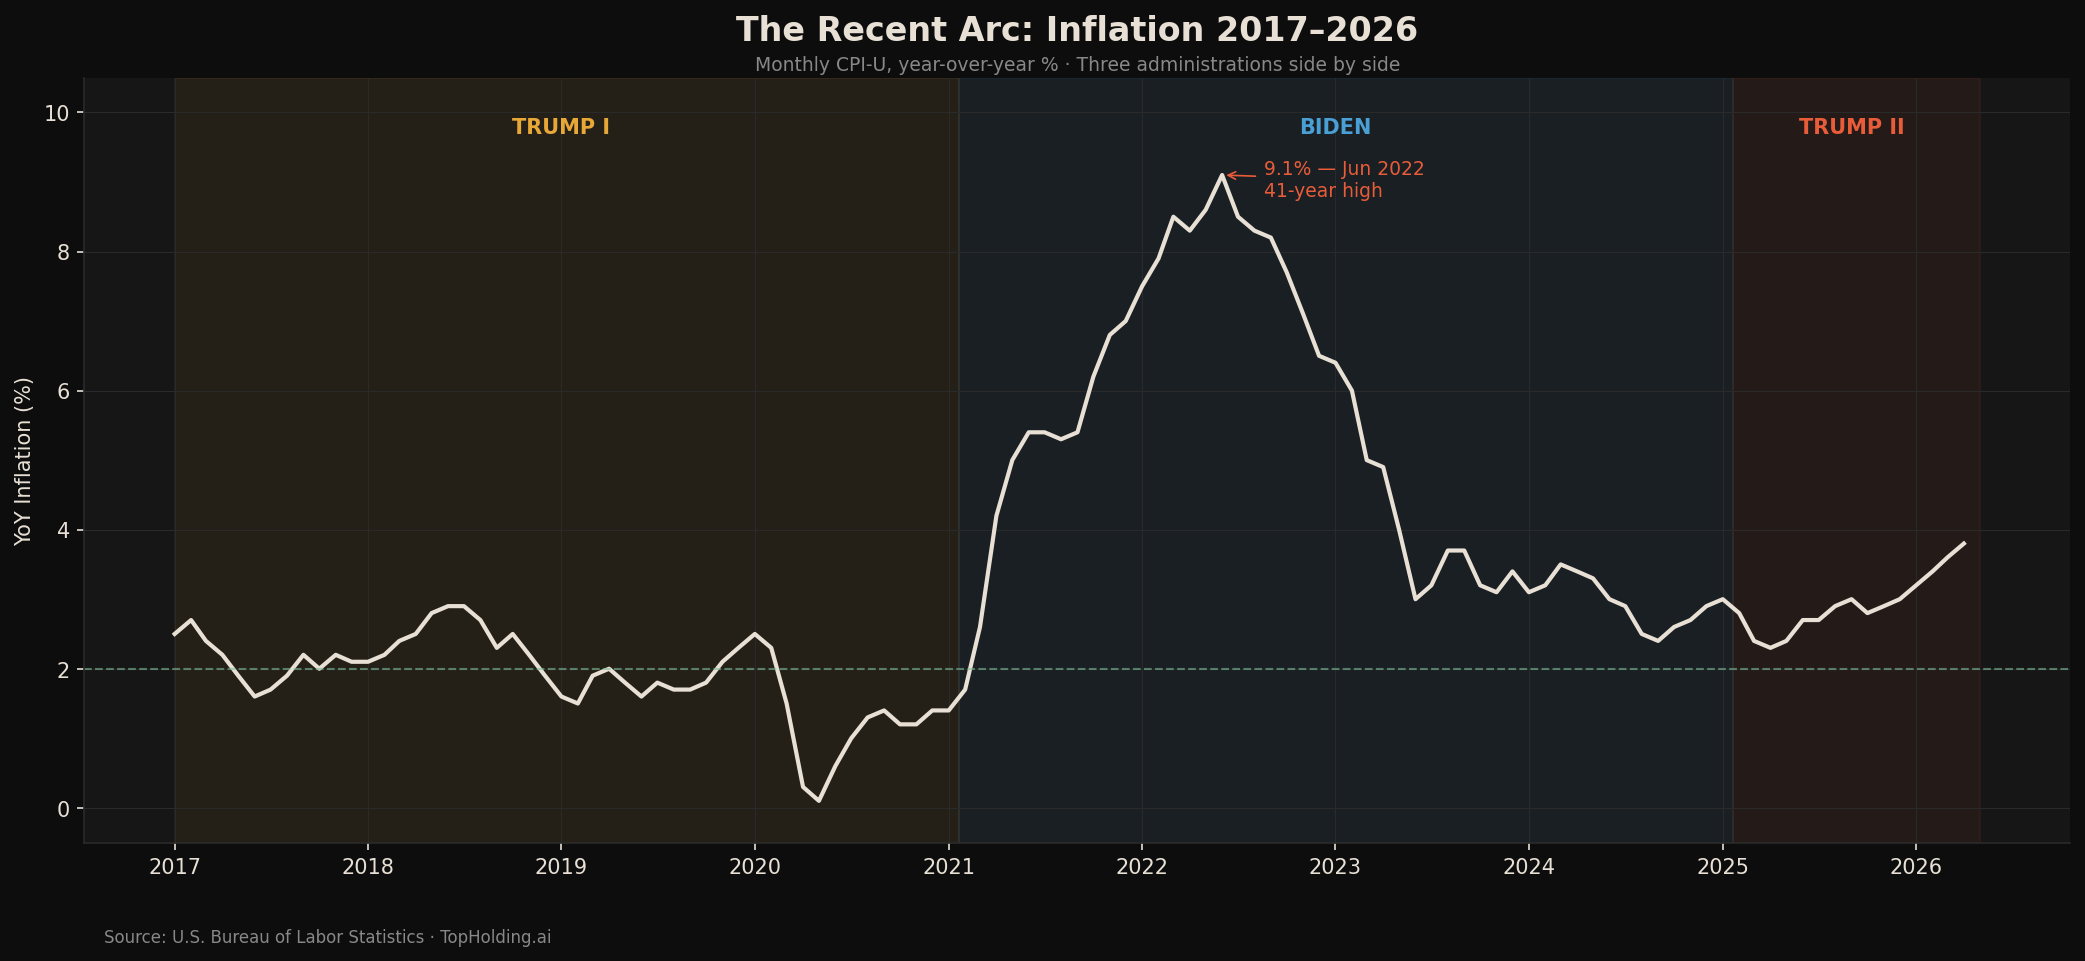
By Biden's last month in office, inflation had fallen back to 3.0% — but the cumulative damage was done. Consumer prices rose 21.5% over Biden's four years, roughly three times the 7.8% cumulative rise under Trump's first term in the same span of months.
Trump II: Lower Print, New Risks
Trump's second term has so far run inflation at roughly 2.8% on average. April 2026 came in at 3.8% year-over-year — uncomfortably above the Fed's 2% target, with energy and food leading the climb. The "Liberation Day" tariffs imposed in April 2025 introduced a new variable that has split the Federal Reserve: the April 2026 FOMC vote was 8–4, the most contentious dissent since October 1992.
The Permanent Damage: What $1 in 1960 Costs Today
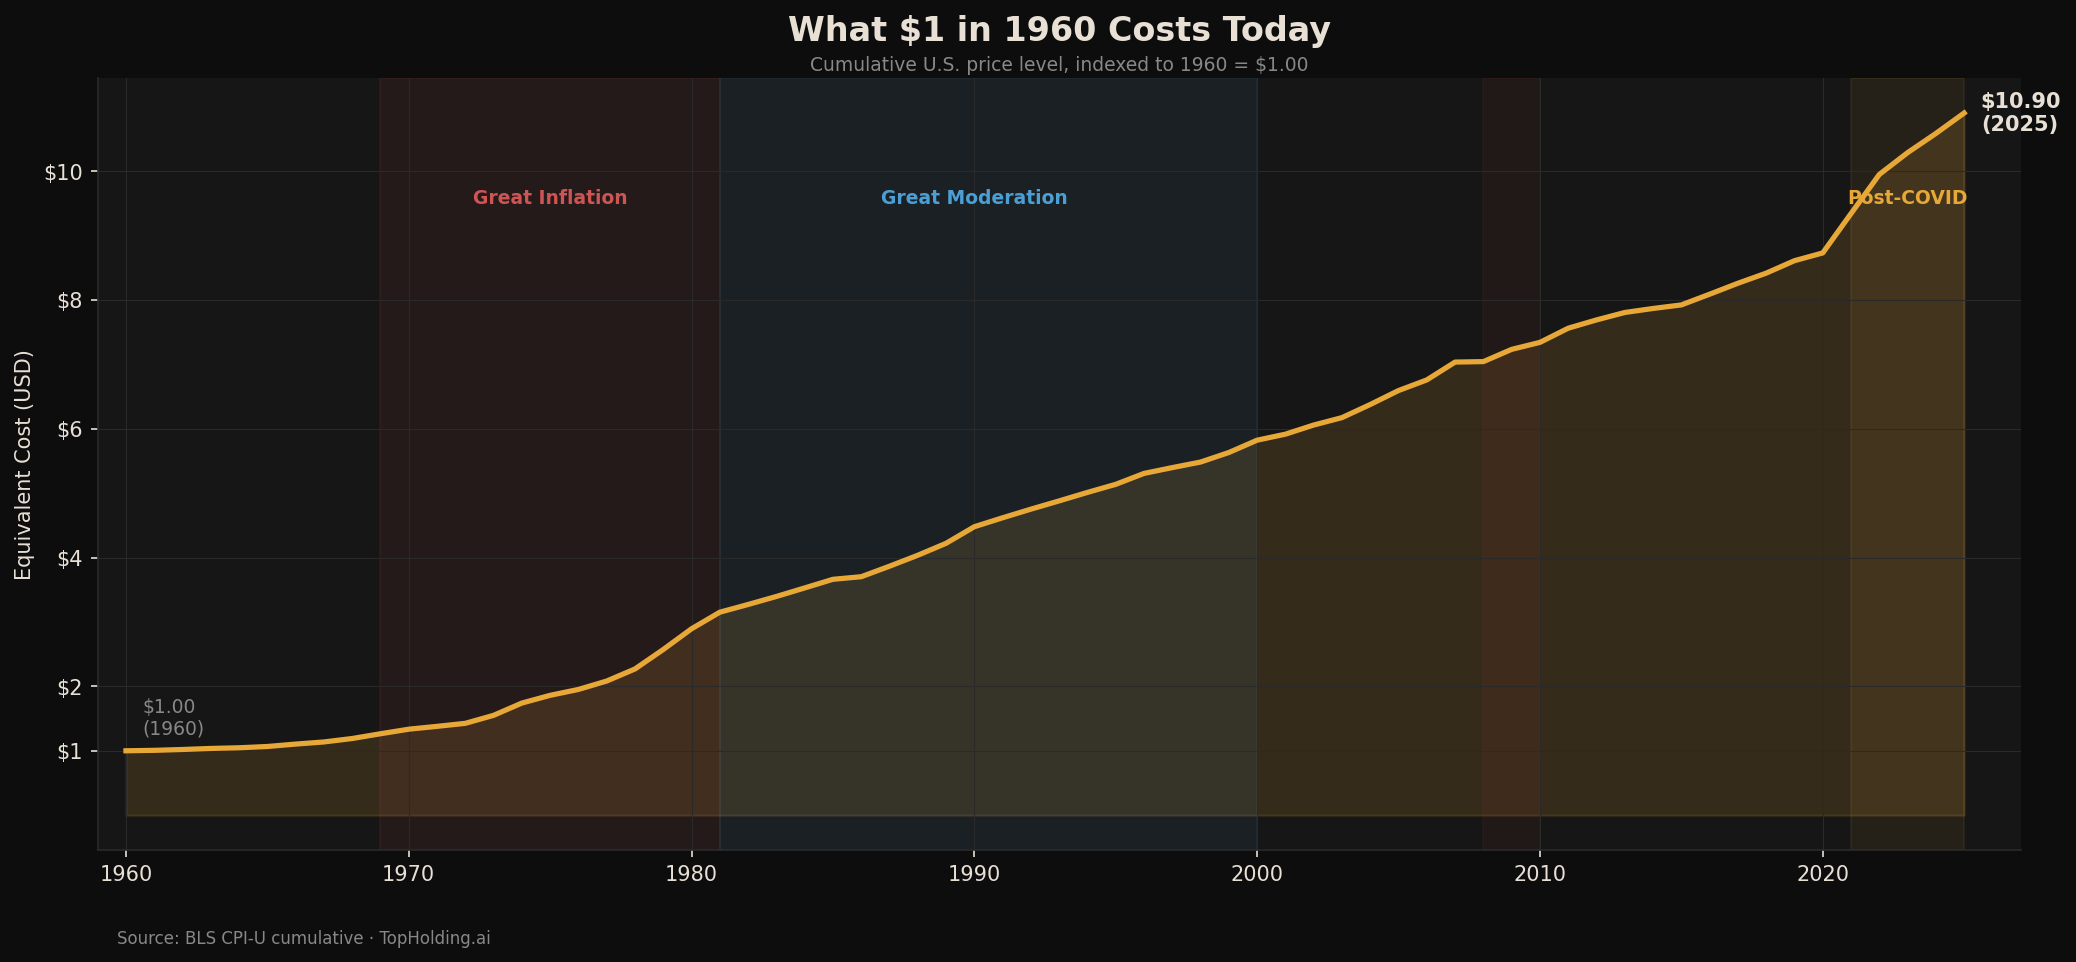
The most important point about inflation is the one politicians never make: it does not reverse. Disinflation means prices rise more slowly, not that they fall back to where they were. A dollar in 1960 buys what about ten cents would buy today.
What the Data Actually Tells Us
No modern president has handed off a stronger currency than the one they inherited. Every administration since Eisenhower has overseen a net loss of purchasing power. The differences between them are differences of degree — and of how fairly that erosion has been distributed across wage earners versus asset holders.
That is the part the spin cycle cannot reach. Inflation is not a partisan story; it is an arithmetic one. The longer you can keep your savings ahead of it, the better off you are — regardless of who is in the White House. Building a portfolio that is structured to outpace inflation, rather than react to headlines about it, is the entire point of long-term investing.
For more historical context on how markets, inflation, and policy interact across decades, explore our free financial literacy library or the analytical tools in our premium tier.