Who Really Controls What You Pay at the Pump?
By TopHolding Editorial · Thursday, May 7, 2026 at 10:31 PM

Gas prices have swung wildly from Trump to Biden and back again — but presidents may matter less than you think. A data-driven look at three administrations, wage growth, oil company profits, and the real forces draining your wallet every time you fill up.
Every time gas prices spike, Americans blame whoever is in the White House. It's a reflex as American as the road trip itself. But the real story of what you pay at the pump is far more complicated — and far more interesting — than any campaign talking point. It involves global oil cartels, two wars, a historic pandemic, record corporate profits, and a federal emergency reserve that became a political football.
We pulled data from the U.S. Energy Information Administration, GasBuddy, the Bureau of Labor Statistics, and corporate earnings reports to give you the complete picture — across three presidential terms.
Gas Prices Across Three Administrations
The national average price of regular unleaded tells a dramatic story. Prices were relatively stable during Trump's first term, crashed during COVID, exploded in Biden's second year when Russia invaded Ukraine, and have since moderated — though a Midwest refinery disruption is pushing prices higher again in May 2026.
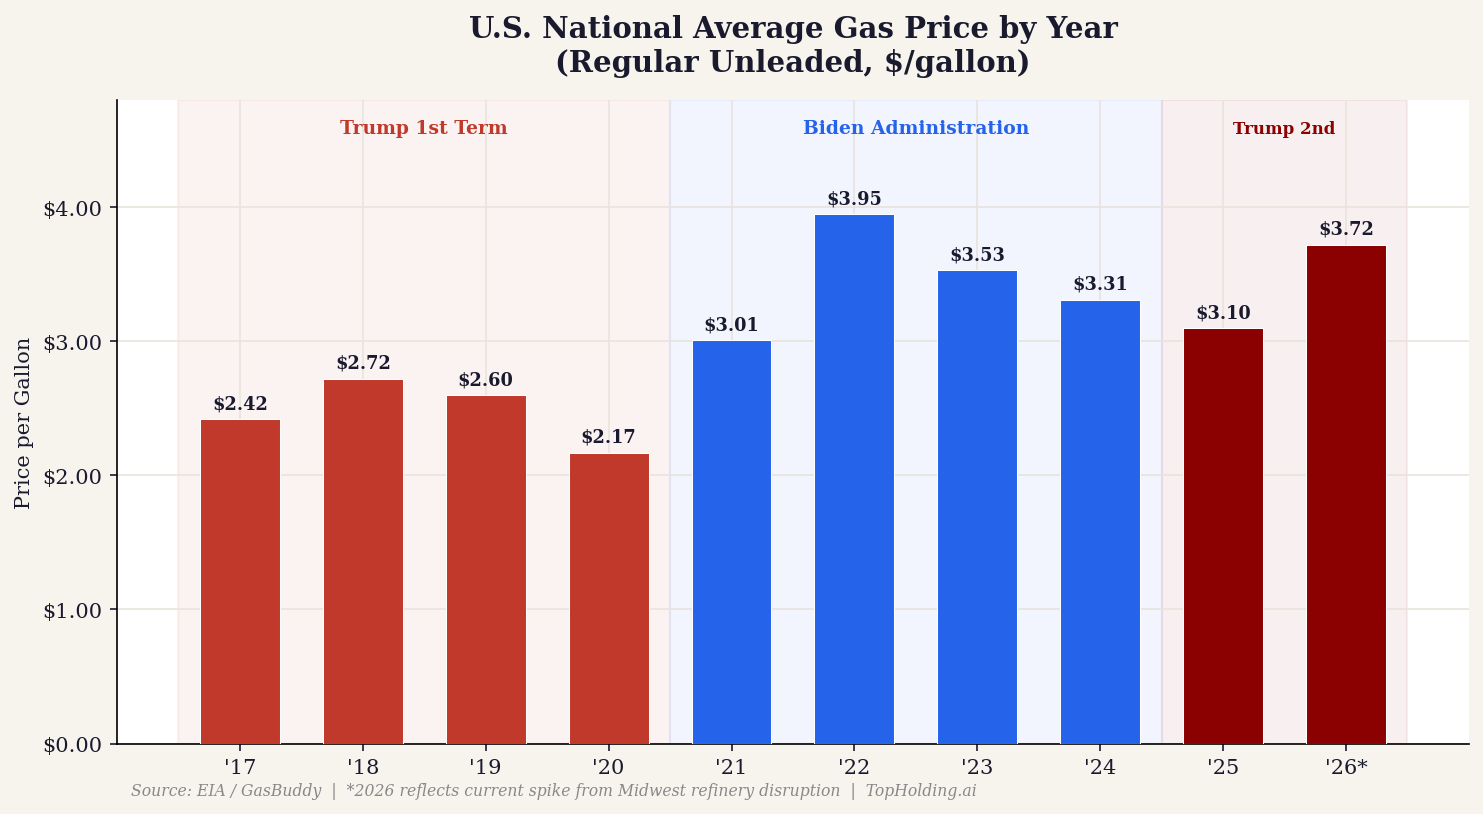
During Trump's first term (2017–2020), the national average hovered between $2.17 and $2.72 per gallon. The Biden era (2021–2024) saw averages between $3.01 and $3.95, peaking at $4.42 nationally in June 2022. Trump's second term opened at $3.10 in January 2025, but a Midwest refinery disruption has pushed the May 2026 average to $3.72.
"The U.S. president, whether Republican or Democrat, does not sway the global balance of supply and demand." — Patrick De Haan, Head of Petroleum Analysis, GasBuddy
Did Your Paycheck Keep Up With the Pump?
The gas price number is only half the story. What matters to your household is the ratio of your wages to what gas costs. When wages rise faster than gas, you're ahead. When they don't, you're being squeezed.
The chart below indexes both gas prices and average hourly wages to 2017 = 100. The red zone shows when gas was outpacing wages (you're losing ground). The green zone shows when wages were winning. Notice the brutal red peak in 2022 — and the steady recovery since 2023 as wages caught up and gas prices fell.
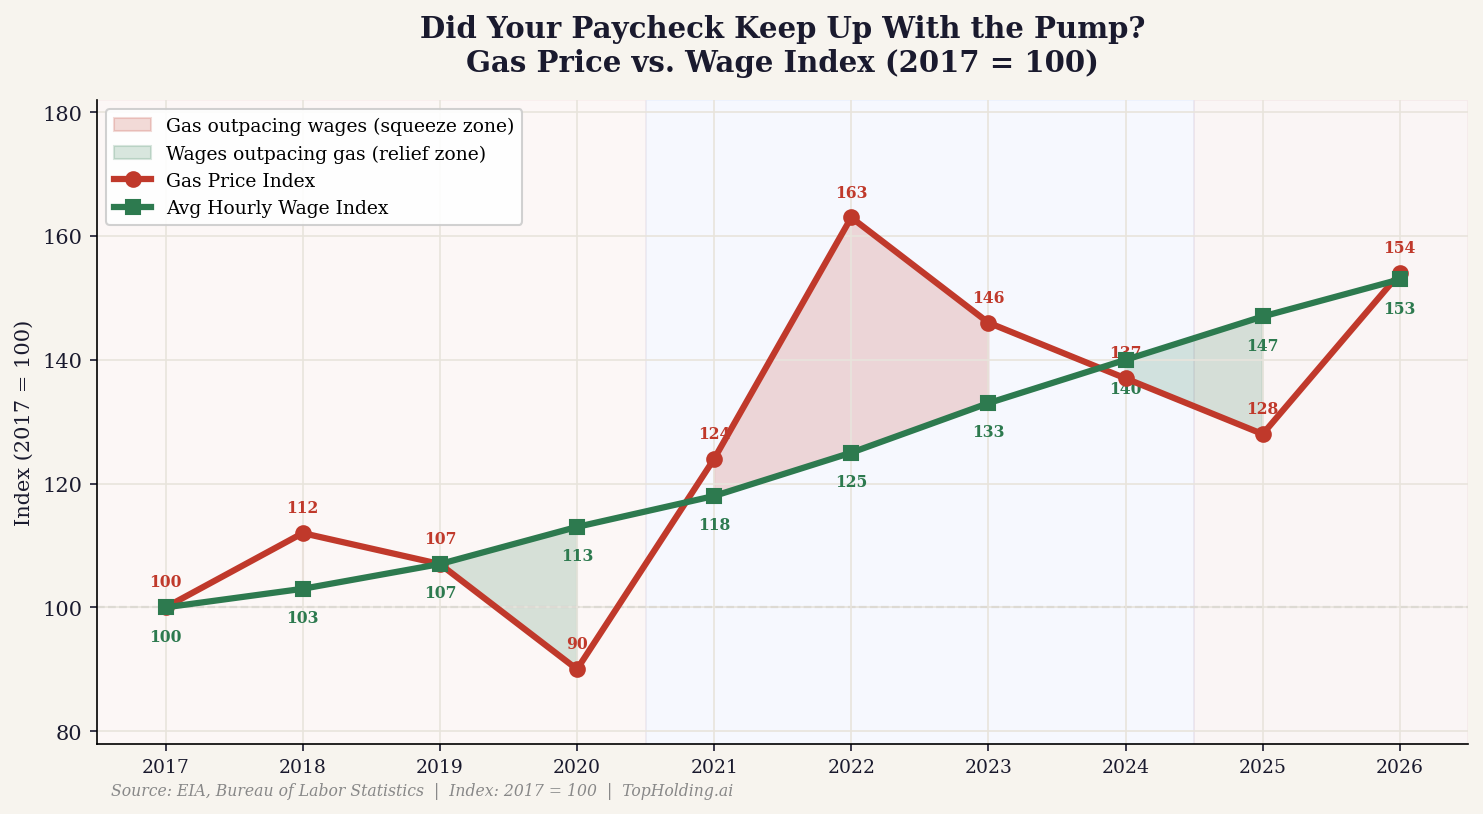
During Trump's first term, gas was cheap and wage growth was modest — the effective burden was low. During Biden's term, wages actually grew significantly (5–6% annually at peak), but gas and broader inflation surged in 2022, creating a painful squeeze. By early 2023, wage growth crossed back above inflation for the first time — and has stayed there since.
Biden's Secret Weapon: The Strategic Petroleum Reserve
Faced with the worst gas prices in a generation, the Biden administration did something no president had done before at this scale: they opened the Strategic Petroleum Reserve (SPR) as an economic policy tool.
In November 2021, a first drawdown released 50 million barrels in coordination with China, India, Japan, South Korea, and the UK as gas prices began climbing. In March 2022 came the historic release: 180 million barrels over 6 months — the largest SPR release in U.S. history — triggered by Russia's invasion of Ukraine cutting global oil supply.
By summer 2022, the SPR dropped to its lowest level since the 1980s. Treasury analysis estimates Americans saved 17–42 cents per gallon — yet gas still peaked near $4.42 nationally. In May 2024, 1 million barrels of gasoline were released from the Northeast Gasoline Supply Reserve ahead of summer driving season. By the end of Biden's term, the administration had repurchased 200 million barrels at ~$74.75/barrel to replenish reserves — though critics noted some barrels were sold at $95+.
While You Paid More, Big Oil Earned More
The most politically charged chapter of this story: while consumers were squeezed at the pump, the largest U.S. oil companies posted record profits. ExxonMobil earned $55.7 billion in net profit in 2022 — the largest annual profit ever recorded by a Western oil company. That's roughly $6.3 million every hour, $105,000 every minute.
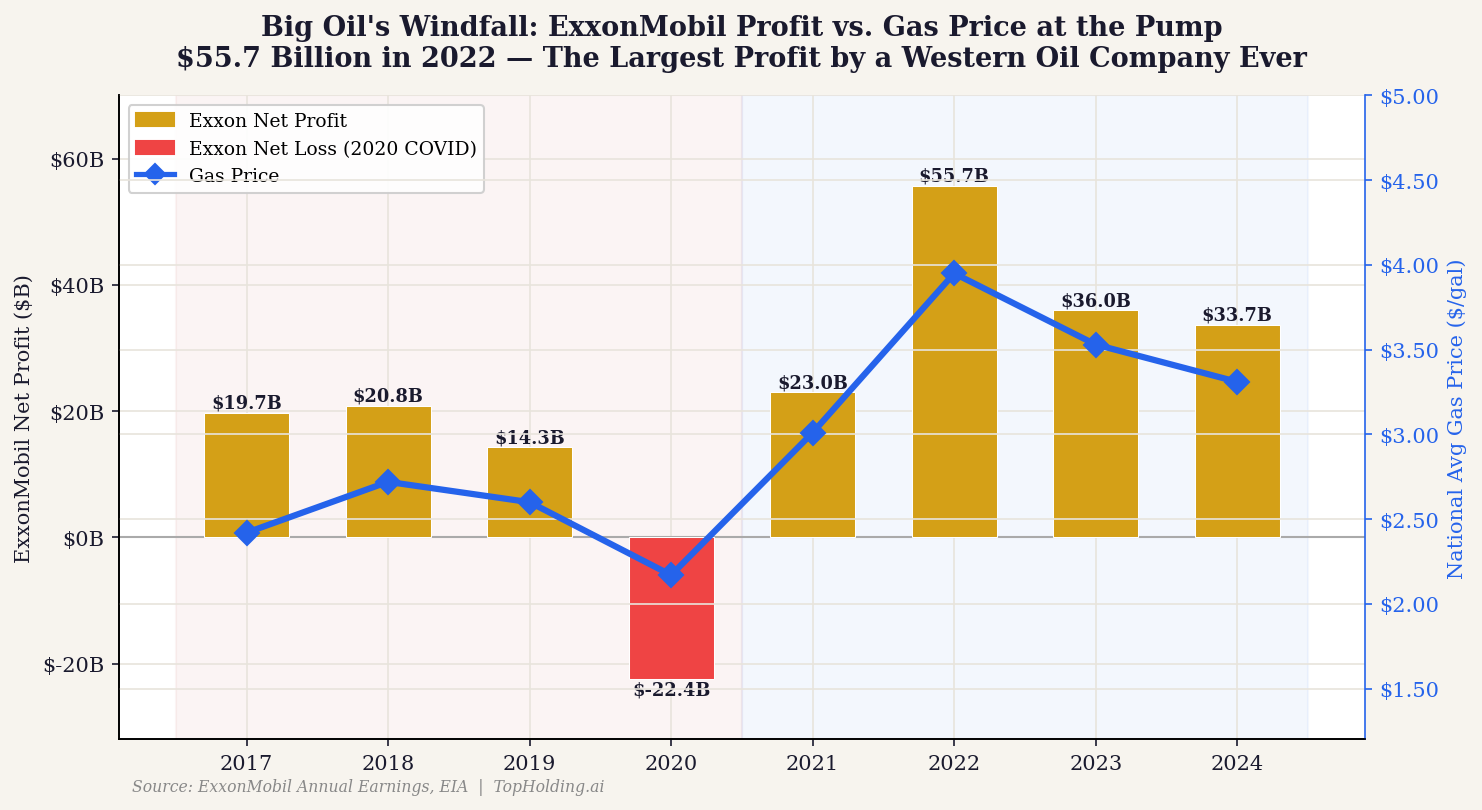
Note the 2020 bar — ExxonMobil actually lost $22.4 billion that year as COVID crushed global demand. The relationship is clear: when the world needs oil and supply is tight, prices spike and profits soar. Presidents can nudge things at the margin, but they can't override these global forces.
Exxon and Chevron combined earned $91 billion in 2022 alone, with Exxon returning $30 billion to shareholders that year. These record profits fueled intense debates about windfall taxes and whether oil companies were engaging in price gouging.
The Missouri Advantage — and the Costco Edge
Missouri consistently ranks among the cheapest states for gas, thanks to lower state fuel taxes and a competitive local market. And within Missouri, membership warehouse clubs like Costco typically run 25–35 cents below the statewide average — saving a typical driver $5–7 per fill-up.
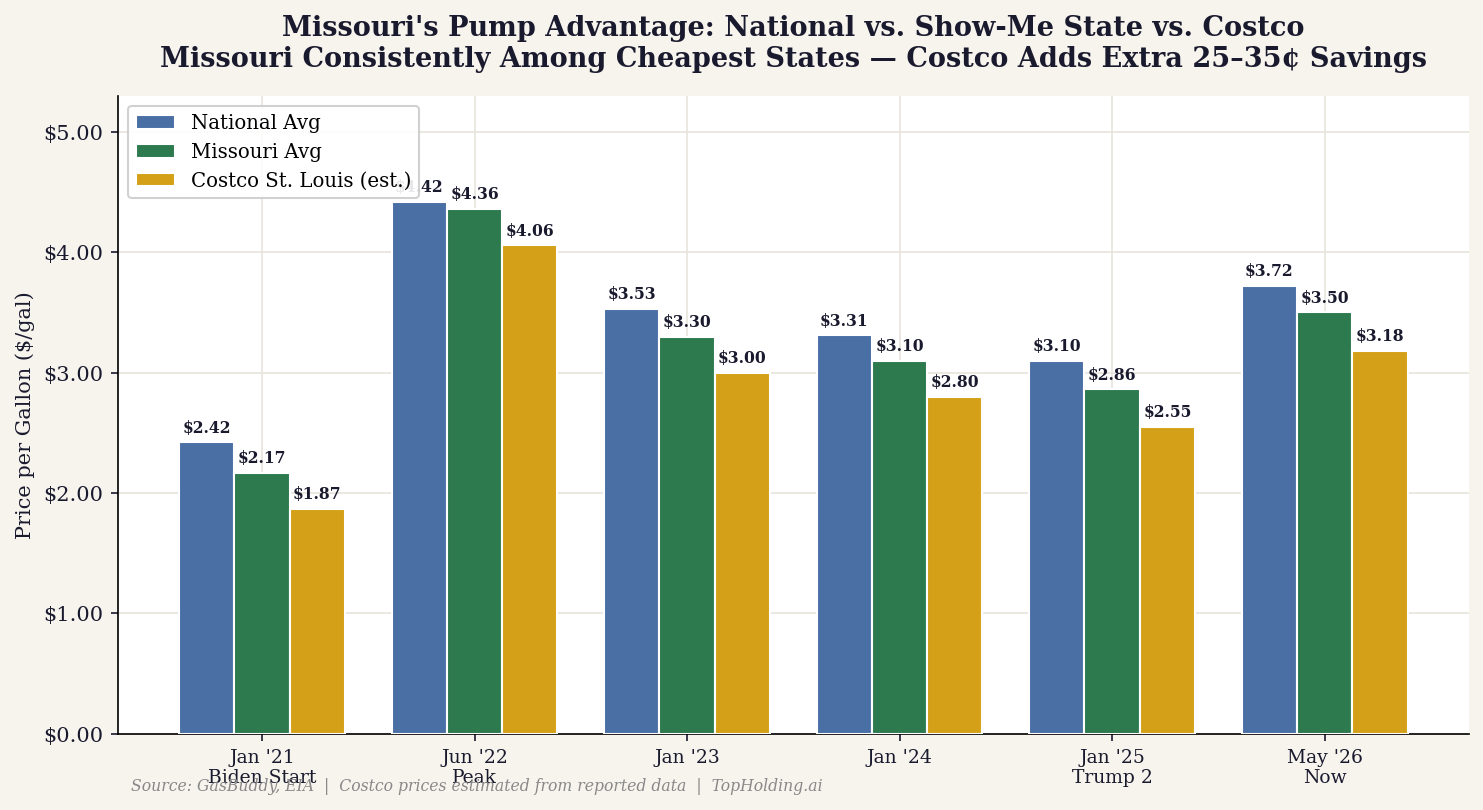
Even at the painful June 2022 peak, Missouri drivers paid about 6 cents less than the national average — and Costco members paid 36 cents less. Over a year of weekly fill-ups, that Costco membership can save a Missouri driver $150–$200 in gas alone.
The 6 Real Drivers of Gas Prices
If presidents don't control gas prices, what does? Here are the forces that actually move the needle:
Crude Oil Price — Accounts for 40–70% of the pump price. Set by global supply and demand, heavily influenced by OPEC+ production decisions made in Riyadh — not Washington.
Refinery Capacity — The U.S. lost significant refinery capacity during COVID and hasn't fully recovered. Seasonal switches to "summer blend" gasoline cause predictable annual spikes every spring.
Geopolitical Conflict — Russia's 2022 Ukraine invasion removed millions of barrels overnight. The 2026 U.S.-Iran tensions are driving the current Midwest price spike.
The U.S. Dollar — Oil is priced in dollars globally. A stronger dollar makes oil cheaper to import; a weaker dollar pushes prices up — independent of any domestic energy policy.
Federal Reserve Policy — Interest rate decisions affect both the dollar's strength and economic activity. The Fed's aggressive 2022–2023 rate hikes eventually helped cool energy inflation.
Weather and Seasonality — Gulf hurricanes disrupting refineries, cold snaps spiking heating oil demand, and summer driving season all create predictable and unpredictable price swings.
The Bottom Line
Gas was cheapest during Trump's first term — but COVID crashed global demand in 2020, which had nothing to do with U.S. policy. The 2022 Biden-era price spike was primarily Russia's invasion of Ukraine disrupting global oil supply — not domestic policy choices. Biden's SPR releases helped soften the blow by 17–42 cents per gallon but couldn't reverse a global supply shock — and left reserves at 1980s lows.
Wages have outpaced inflation since early 2023, meaning real purchasing power is recovering — but $4+ gas left a lasting impression on voters. Big Oil posted record profits in 2022 while consumers struggled — $91 billion combined for Exxon and Chevron alone — fueling windfall tax debates.
Missouri drivers save 20–30 cents per gallon vs. the national average. Add a Costco membership and you save another 25–35 cents on top of that. The May 2026 spike is temporary — a Midwest refinery event. Watch crude oil futures (WTI) for the real directional signal on where prices are headed.
Sources: U.S. Energy Information Administration (EIA), GasBuddy, Bureau of Labor Statistics, U.S. Treasury Department, ExxonMobil and Chevron annual earnings reports, Federal Reserve Bank of Atlanta Wage Growth Tracker, AAA Gas Prices, U.S. Department of Energy. This article is for informational and educational purposes only and does not constitute investment advice.